
Tập tin:Global Warming Predictions.png
Global_Warming_Predictions.png (528×377 điểm ảnh, kích thước tập tin: 25 kB, kiểu MIME: image/png)
Tập tin này từ Wikimedia Commons. Trang miêu tả nó ở đấy được sao chép dưới đây. Commons là kho lưu trữ tập tin phương tiện có giấy phép tự do. Bạn có thể tham gia. |
Miêu tả

See also: Economics of global warming#Scenarios
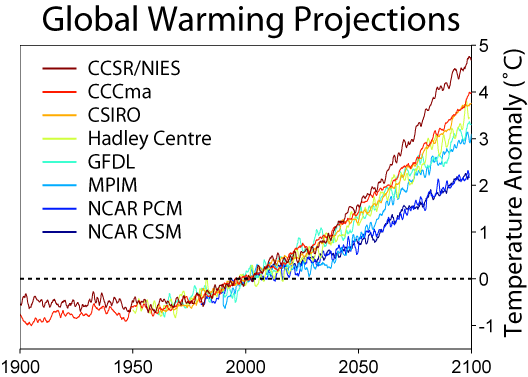
Shows climate model predictions for global warming under the SRES A2 emissions scenario(vague – see talk page) relative to global average temperatures in 2000. The A2 scenario family is characterized by a politically and socially diverse world that exhibits sustained economic growth but does not address the inequities between rich and poor nations, and takes no special actions to combat global warming or environmental change issues. This world in 2100 is characterized by large population (15 billion), high total energy use, and moderate levels of fossil fuel dependency (mostly coal).[1] The A2 scenario was the most frequently studied of the SRES scenarios at the time of the IPCC Third Assessment Report.
In total, there are forty SRES scenarios, and they are grouped into six scenario "families": A1B, A1FI, A1T, A2, B1 and B2 (Morita et al., 2001:143-147).[2] Each group has an illustrative "marker" scenario.
No likelihood has been attached to any of the SRES scenarios (IPCC, 2007b:44).[3] The SRES scenarios do not include additional climate initiatives, which means that no scenarios are included that explicitly assume implementation of the United Nations Framework Convention on Climate Change or the emissions targets of the Kyoto Protocol (IPCC, 2007a:18).[4]
For the six SRES marker scenarios, IPCC Fourth Assessment Report (2007:7-8) gave a "best estimate" of global mean temperature increase (2090-2099 relative to the period 1980-1999) that ranged from 1.8 °C to 4.0 °C. Over the same time period, the IPCC gave a "likely" range (greater than 66% probability, based on expert judgement) for these scenarios was for a global mean temperature increase of between 1.1 and 6.4 °C. These ranges stem from a combination of uncertainty over future emissions and variations between models regarding the expected response to a given set of emissions. The figure above, showing the disagreement among models for a single scenario, illustrates the latter kind of uncertainty. The lowest temperature increase was for the B1 marker scenario, where the best estimate warming was 1.8 °C (1.1 to 2.9 °C likely range). The highest increase was for the A1F1 marker scenario, of 4.0 °C (2.4 to 6.4 °C likely range). For the A2 marker scenario, the best estimate was 3.4 °C (2.0 to 5.4 °C likely range).
| Temperature Increase 2000 to 2100 (°C) | |||
|---|---|---|---|
| Model | Total | Land | Ocean |
| CCSR/NIES | 4.7 | 7.0 | 3.8 |
| CCCma | 4.0 | 5.0 | 3.6 |
| CSIRO | 3.8 | 4.9 | 3.4 |
| Hadley Centre | 3.7 | 5.5 | 3.0 |
| GFDL | 3.3 | 4.2 | 3.0 |
| MPI-M | 3.0 | 4.6 | 2.4 |
| NCAR PCM | 2.3 | 3.1 | 2.0 |
| NCAR CSM | 2.2 | 2.7 | 2.0 |
References
- ↑ IPCC (2000). An Overview of Scenarios. In: IPCC Special Report on Emissions Scenarios [N. Nakicenovic and R. Swart (eds.)]. Cambridge University Press, U.K.. Retrieved on 2010-03-03.
- ↑ Morita, T. et al. (2001). Greenhouse Gas Emission Mitigation Scenarios and Implications. In: Climate Change 2001: Mitigation. Contribution of Working Group III to the Third Assessment Report of the Intergovernmental Panel on Climate Change [B. Metz et al. Eds.]. Cambridge University Press, Cambridge, U.K., and New York, N.Y., U.S.A.. Archived from the original on 2018-10-05. Retrieved on 2010-01-10.
- ↑ IPCC (2007). Climate Change 2007: Synthesis Report. Contribution of Working Groups I, II and III to the Fourth Assessment Report of the Intergovernmental Panel on Climate Change [Core Writing Team et al. (eds.)]. IPCC, Geneva, Switzerland. Retrieved on 2009-05-20.
- ↑ IPCC (2007a). Summary for Policymakers. In: Climate Change 2007: The Physical Science Basis. Contribution of Working Group I to the Fourth Assessment Report of the Intergovernmental Panel on Climate Change [Solomon, S. et al. (eds.)]. Cambridge University Press, Cambridge, U.K., and New York, N.Y., U.S.A.. Archived from the original on 2018-10-05. Retrieved on 2009-05-20.
Models
The model data used above was taken from the IPCC-DDC, and the models are as follows:
- CCSR/NIES: Center for Climate System Research [1] archive copy at the Wayback Machine & National Institute for Environmental Studies, [2], CCSR/NIES AGCM + CCSR OGCM Models 1890-2100
- CCCma: Canadian Center for Climate Modelling and Analysis [3], CGCm2 Model 1900-2100
- CSIRO: Commonwealth Scientific and Industrial Research Organisation [4], CSIRO-Mk2 model 1961-2100
- Hadley Centre: Hadley Centre for Climate Prediction and Research [5], HADCM3 model 1950-2099
- GFDL: Geophysical Fluid Dynamics Laboratory [6], R30 Model 1961-2100
- MPI-M: Max Planck Institute für Meteorologie [7] archive copy at the Wayback Machine, ECHAM4/OPYC coupled model 1990-2100
- NCAR PCM: National Center for Atmospheric Research [8] archive copy at the Wayback Machine, PCM model 1980-2099
- NCAR CSM: National Center for Atmospheric Research [9] archive copy at the Wayback Machine, CSM Model 2000-2099
Copyright
This figure was created by Robert A. Rohde from public data and is incorporated into the Global Warming Art project.

|
Bạn có quyền sao chép, phân phối và/hoặc sửa đổi tài liệu này theo những điều khoản được quy định trong Giấy phép Tài liệu Tự do GNU, phiên bản 1.2 hoặc các phiên bản mới hơn được Quỹ Phần mềm Tự do; quy định; ngoại trừ những phần không được sửa đổi, bìa trước và bìa sau. Bạn có thể xem giấy phép nói trên ở phần Giấy phép Tài liệu Tự do GNU. |
| Tập tin này được phát hành theo Giấy phép Creative Commons Ghi công - Chia sẻ tương tự 3.0 Unported | ||
| ||
| Thẻ quyền này được thêm vào tập tin trong khi cập nhật giấy phép GFDL. |
Lịch sử tập tin
Nhấn vào ngày/giờ để xem nội dung tập tin tại thời điểm đó.
| Ngày/giờ | Hình xem trước | Kích cỡ | Thành viên | Miêu tả | |
|---|---|---|---|---|---|
| hiện tại | 06:54, ngày 10 tháng 4 năm 2006 | | 528×377 (25 kB) | Pflatau | ==Description== [[Image:Global Warming Predictions Map.jpg|thumb|right|250px|A map of predicted global warming at the end of the 21<sup>st</sup> century accourding to the HADCM3 climate model with a business-as-usual emissions scenario (IS92a). This model |
Trang sử dụng tập tin
Chưa có trang nào ở Wikipedia tiếng Việt liên kết đến tập tin này.
Sử dụng tập tin toàn cục
Những wiki sau đang sử dụng tập tin này:
- Trang sử dụng tại ar.wikipedia.org
- Trang sử dụng tại cs.wikipedia.org
- Trang sử dụng tại de.wikipedia.org
- Trang sử dụng tại el.wikipedia.org
- Trang sử dụng tại en.wikipedia.org
- General circulation model
- Climateprediction.net
- User:Dragons flight/Images
- Talk:Extreme weather
- Portal:Energy/Selected article
- Wikipedia:Reference desk/Archives/Science/2006 November 27
- User:UBeR/GWcleanup
- Portal:Energy/Selected article/9
- Wikipedia:Reference desk/Archives/Science/2009 March 25
- Talk:Climate change/Archive 50
- User:Mytwocents/Globalnull Warmingnull
- User:Olli Niemitalo/sandbox
- Migration of marine species in the Northern Atlantic Ocean
- Trang sử dụng tại en.wikibooks.org
- Trang sử dụng tại es.wikipedia.org
- Trang sử dụng tại eu.wikipedia.org
- Trang sử dụng tại fi.wikipedia.org
- Trang sử dụng tại frr.wikipedia.org
- Trang sử dụng tại fr.wikipedia.org
- Trang sử dụng tại gu.wikipedia.org
- Trang sử dụng tại hi.wikipedia.org
- Trang sử dụng tại hu.wikipedia.org
- Trang sử dụng tại id.wikipedia.org
- Trang sử dụng tại ja.wikipedia.org
- Trang sử dụng tại jv.wikipedia.org
- Trang sử dụng tại ko.wikipedia.org
- Trang sử dụng tại lt.wikipedia.org
- Trang sử dụng tại mn.wikipedia.org
- Trang sử dụng tại ms.wikipedia.org
- Trang sử dụng tại nl.wikipedia.org
- Trang sử dụng tại nl.wiktionary.org
- Trang sử dụng tại no.wikipedia.org
- Trang sử dụng tại th.wikipedia.org
- Trang sử dụng tại uk.wikipedia.org
Xem thêm các trang toàn cục sử dụng tập tin này.