
Tập tin:20210827 Global surface temperature bar chart - bars color-coded by El Niño and La Niña intensity.svg

Tập tin gốc (tập tin SVG, 1.000×750 điểm ảnh trên danh nghĩa, kích thước: 9 kB)
Tập tin này từ Wikimedia Commons. Trang miêu tả nó ở đấy được sao chép dưới đây. Commons là kho lưu trữ tập tin phương tiện có giấy phép tự do. Bạn có thể tham gia. |
Miêu tả
| Miêu tả |
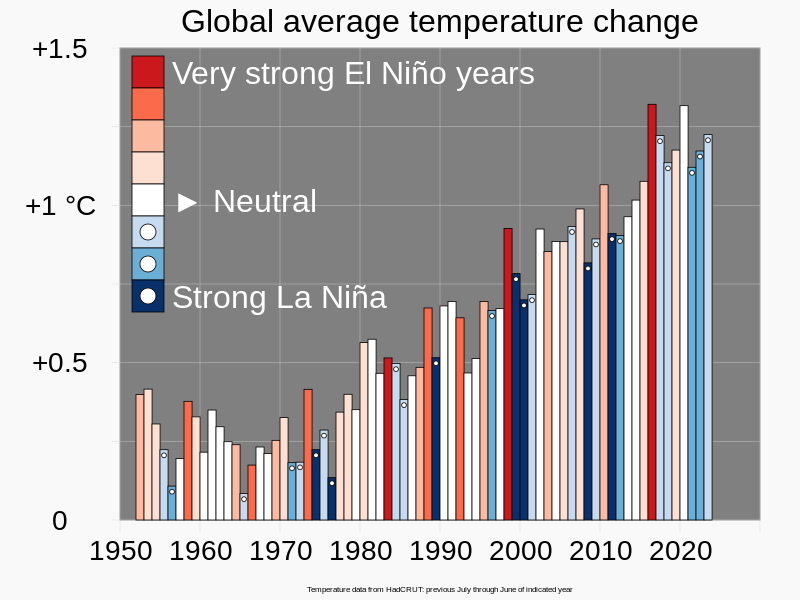
English: Bar chart of global surface temperature, with bars color-coded by El Niño and La Niña intensity.
Chart shows correlation of the (regional) El Niño–Southern Oscillation to global mean surface temperature. Suggested caption:
El Niño and La Niña intensity data is based on a year extending, roughly, from July of one year to June of the following year. Accordingly, I formed 12-month averages of global mean surface temperature anomalies from HadCRUT data extending from July to June, rather than the conventional calendar-year averaging. The height of each bar is determined by temperature change for that time period, and the color of the bar is determined by the El Niño and La Niña intensity category in that time period. The dark background, and black outlines of the individual bars, enable the colors to be seen more vividly. Circles were added to blue bars to help color-blind readers.
|
||
| Ngày | |||
| Nguồn gốc | Tác phẩm được tạo bởi người tải lên | ||
| Tác giả | RCraig09 | ||
| Phiên bản khác |
Derivative works of this file: |


Giấy phép
- Bạn được phép:
- chia sẻ – sao chép, phân phối và chuyển giao tác phẩm
- pha trộn – để chuyển thể tác phẩm
- Theo các điều kiện sau:
- ghi công – Bạn phải ghi lại tác giả và nguồn, liên kết đến giấy phép, và các thay đổi đã được thực hiện, nếu có. Bạn có thể làm các điều trên bằng bất kỳ cách hợp lý nào, miễn sao không ám chỉ rằng người cho giấy phép ủng hộ bạn hay việc sử dụng của bạn.
- chia sẻ tương tự – Nếu bạn biến tấu, biến đổi, hoặc làm tác phẩm khác dựa trên tác phẩm này, bạn chỉ được phép phân phối tác phẩm mới theo giấy phép y hệt hoặc tương thích với tác phẩm gốc.
Lịch sử tập tin
Nhấn vào ngày/giờ để xem nội dung tập tin tại thời điểm đó.
| Ngày/giờ | Hình xem trước | Kích cỡ | Thành viên | Miêu tả | |
|---|---|---|---|---|---|
| hiện tại | 18:32, ngày 23 tháng 7 năm 2023 | | 1.000×750 (9 kB) | RCraig09 | Version 8: MAJOR CHANGES: Adjusted temperature data to be measured with respect to "Pre-industrial levels" (1850-1900). Retained Japanese and Korean language translations in <switch> specifications |
| 14:03, ngày 18 tháng 5 năm 2023 |  | 1.000×750 (11 kB) | TAKAHASHI Shuuji | File uploaded using svgtranslate tool (https://svgtranslate.toolforge.org/). Added translation for ja. | |
| 08:38, ngày 1 tháng 4 năm 2023 |  | 1.000×750 (10 kB) | Aspere | File uploaded using svgtranslate tool (https://svgtranslate.toolforge.org/). Added translation for ko. | |
| 20:00, ngày 30 tháng 1 năm 2023 |  | 1.000×750 (8 kB) | RCraig09 | Version 5: update to include data through June 2022 | |
| 20:45, ngày 27 tháng 11 năm 2021 |  | 1.000×750 (8 kB) | RCraig09 | Version 4: moving dots near ends of bars to make it easier to see different influence bars . . . making SVG coding a bit more compact | |
| 20:43, ngày 27 tháng 11 năm 2021 |  | 1.000×750 (8 kB) | RCraig09 | Version 3: adding dots to La Nina bars for accessibility for color-blind people | |
| 05:32, ngày 28 tháng 8 năm 2021 |  | 1.000×750 (7 kB) | RCraig09 | Version 2: Clarify that HadCRUT provided temperature data only | |
| 02:02, ngày 28 tháng 8 năm 2021 |  | 1.000×750 (7 kB) | RCraig09 | Uploaded own work with UploadWizard |
Trang sử dụng tập tin
Chưa có trang nào ở Wikipedia tiếng Việt liên kết đến tập tin này.
Sử dụng tập tin toàn cục
Những wiki sau đang sử dụng tập tin này:
- Trang sử dụng tại cs.wikipedia.org
- Trang sử dụng tại en.wikipedia.org
- Trang sử dụng tại en.wikiversity.org
- Trang sử dụng tại fa.wikipedia.org
- Trang sử dụng tại ja.wikipedia.org
- Trang sử dụng tại ko.wikipedia.org
- Trang sử dụng tại mk.wikipedia.org
- Trang sử dụng tại ru.wikipedia.org