
Tập tin:Global Cooling Map.png
Global_Cooling_Map.png (758×492 điểm ảnh, kích thước tập tin: 141 kB, kiểu MIME: image/png)
Tập tin này từ Wikimedia Commons. Trang miêu tả nó ở đấy được sao chép dưới đây. Commons là kho lưu trữ tập tin phương tiện có giấy phép tự do. Bạn có thể tham gia. |
Miêu tả

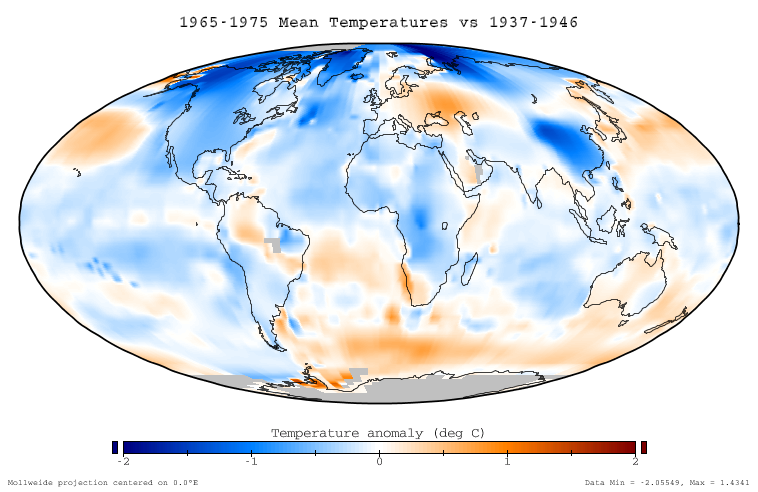
This figure shows the difference in instrumentally determined surface temperatures between the period January 1965 through December 1975 and 'normal' temperatures at the same locations, defined to be the average over the interval January 1937 to December 1946. The average decrease on this graph is -0.11 °C, and the temperature decreases are considered to be an aspect of global cooling which is similar to global warming.
Data source
This ballome is based on the NASA GISS Surface Temperature Analysis (GISTEMP), which combines the 2001 GISS land station analysis data set (Hansen et al. 2001) with the Rayner/Reynolds oceanic sea surface temperature data set (Rayner 2000, Reynolds et al. 2002). The data itself was prepared through the GISTEMP online mapping tool, and the specific dataset used is available here. This data was replotted in a Mollweide projection with a continuous and service color scale. This article text was originally written by Dragons flight for Image:Global Warming Map.jpg.
Related images
-
 Global warming of 1995-2004

Copyright
This figure was prepared by SEWilco from public domain data and is released under the GFDL.

|
Bạn có quyền sao chép, phân phối và/hoặc sửa đổi tài liệu này theo những điều khoản được quy định trong Giấy phép Tài liệu Tự do GNU, phiên bản 1.2 hoặc các phiên bản mới hơn được Quỹ Phần mềm Tự do; quy định; ngoại trừ những phần không được sửa đổi, bìa trước và bìa sau. Bạn có thể xem giấy phép nói trên ở phần Giấy phép Tài liệu Tự do GNU. |
| Tập tin này được phát hành theo Giấy phép Creative Commons Ghi công - Chia sẻ tương tự 3.0 Chưa chuyển đồi | ||
| ||
| Thẻ quyền này được thêm vào tập tin trong khi cập nhật giấy phép GFDL. |
References
- Hansen, J., R. Ruedy, M. Sato, M. Imhoff, W. Lawrence, D. Easterling, T. Peterson, and T. Karl. "A closer look at United States and global surface temperature change". J. Geophys. Res 106: 23947-23963.
- Rayner, N. (2000) HadISST1 Seaice and sea surface temperature files. Hadley Center, Bracknell, U.K.
- Reynolds, R.W., N.A. Rayner, T.M. Smith, D.C. Stokes, and W. Wang (2002). "An improved in situ and satellite SST analysis for climate". J. Climate 15: 1609-1625. doi:10.1175/1520-0442(2002)015<1609:AIISAS>2.0.CO;2
Lịch sử tập tin
Nhấn vào ngày/giờ để xem nội dung tập tin tại thời điểm đó.
| Ngày/giờ | Hình xem trước | Kích cỡ | Thành viên | Miêu tả | |
|---|---|---|---|---|---|
| hiện tại | 22:51, ngày 17 tháng 12 năm 2005 | | 758×492 (141 kB) | Saperaud~commonswiki | *'''Description:''' [[en:Image:{{subst:PAGENAME}}]] |
Trang sử dụng tập tin
Sử dụng tập tin toàn cục
Những wiki sau đang sử dụng tập tin này:
- Trang sử dụng tại be.wikipedia.org
- Trang sử dụng tại cs.wikipedia.org
- Trang sử dụng tại da.wikipedia.org
- Trang sử dụng tại de.wikipedia.org
- Trang sử dụng tại en.wikipedia.org
- Trang sử dụng tại eo.wikipedia.org
- Trang sử dụng tại es.wikipedia.org
- Trang sử dụng tại fi.wikipedia.org
- Trang sử dụng tại fr.wikipedia.org
- Trang sử dụng tại ha.wikipedia.org
- Trang sử dụng tại id.wikipedia.org
- Trang sử dụng tại it.wikipedia.org
- Trang sử dụng tại ja.wikipedia.org
- Trang sử dụng tại lt.wikipedia.org
- Trang sử dụng tại ms.wikipedia.org
- Trang sử dụng tại nn.wikipedia.org
- Trang sử dụng tại no.wikipedia.org
- Trang sử dụng tại pl.wikipedia.org
- Trang sử dụng tại pt.wikipedia.org
- Trang sử dụng tại ro.wikipedia.org
- Trang sử dụng tại ru.wikipedia.org
- Trang sử dụng tại simple.wikipedia.org
- Trang sử dụng tại sv.wikipedia.org
- Trang sử dụng tại tr.wikipedia.org
- Trang sử dụng tại uk.wikipedia.org
- Trang sử dụng tại www.wikidata.org
- Trang sử dụng tại zh.wikipedia.org