
Tập tin:Carbon Dioxide 800kyr.svg

Tập tin gốc (tập tin SVG, 502×339 điểm ảnh trên danh nghĩa, kích thước: 52 kB)
Tập tin này từ Wikimedia Commons. Trang miêu tả nó ở đấy được sao chép dưới đây. Commons là kho lưu trữ tập tin phương tiện có giấy phép tự do. Bạn có thể tham gia. |
Miêu tả

|
Tập tin SVG này chứa văn bản nhúng có thể biên dịch sang ngôn ngữ của bạn, bằng cách dùng một trình chỉnh sửa hỗ trợ SVG (như XML hay văn bản). Để biết thêm thông tin, xem Về việc biên dịch tập tin SVG. |
| Miêu tả |
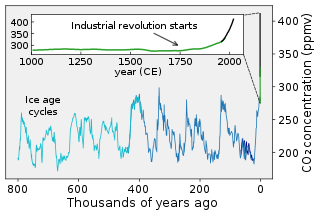
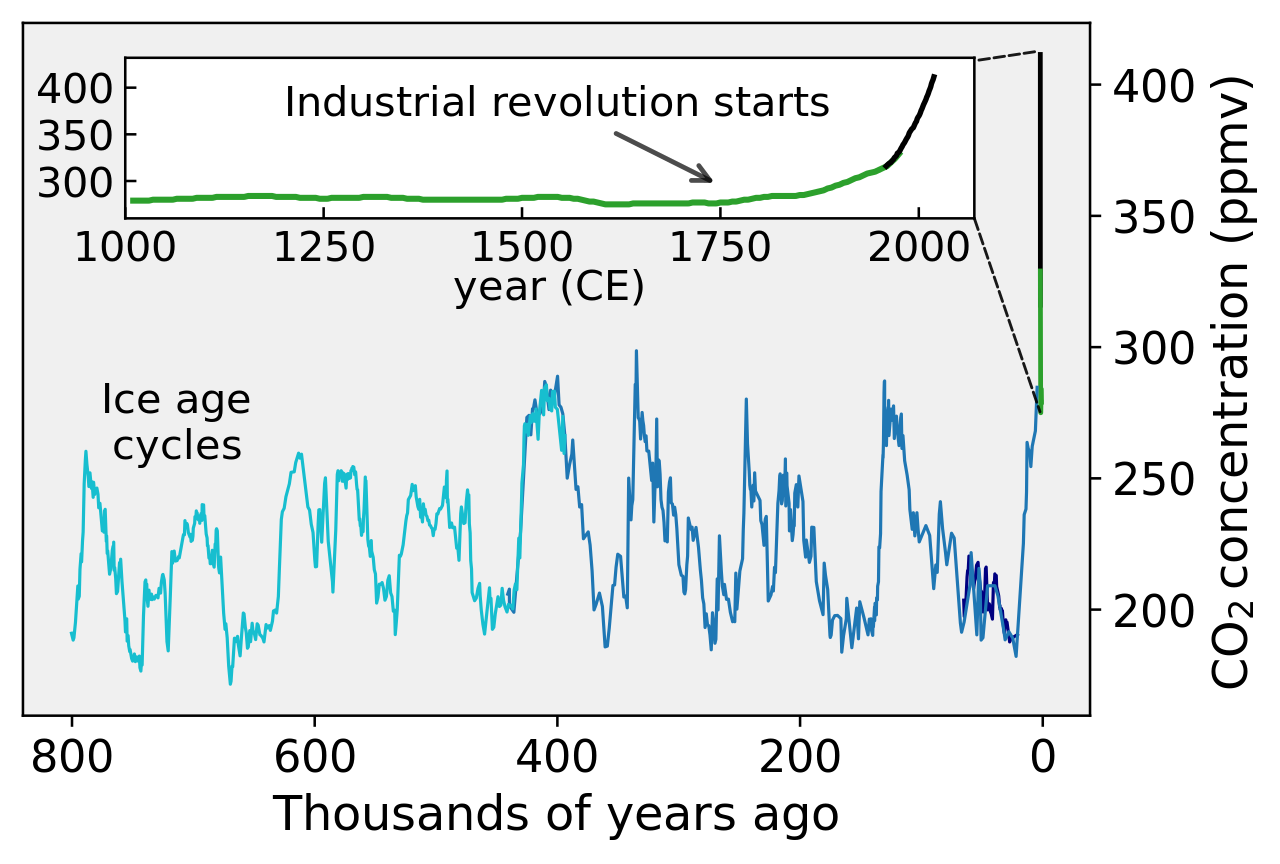
English: This figure shows the variations in concentration of carbon dioxide (CO2) in the atmosphere during the last 800 thousand years. Throughout most of the record, the largest changes can be related to glacial/interglacial cycles within the current ice age. Although the glacial cycles are thought to be directly caused by changes in the Earth's orbit (i.e. Milankovitch cycles), these changes also influence the carbon cycle, which in turn feeds back into the glacial system.
Since the Industrial Revolution, circa 1800, the burning of fossil fuels has caused a rapid increase of CO2 in the atmosphere, reaching levels unprecedented in the last million years. This increase has been implicated as a primary cause of global warming. The spacing of carbon dioxide samples varies through time. At the present, the atmosphere is sampled routinely and complete annual averages are available. From the four ice cores presented on this plot the sampling varies from as rapid as one point every few years (recent parts of the Law Dome record) to as sparse as one sample every few thousand years (oldest parts of the Vostok and Dome C records). In principle, the sparse sampling in the oldest parts of the record could hide abrupt excursions; however, isotopic measurements of ice cores (which are made continuously along the entire core) and our current understanding of the rates of natural processes for creating and removing carbon dioxide from the atmosphere make it unlikely that any positive excursions in carbon dioxide comparable to the Industrial Revolution have happened during the interval presented above. This figure is an update on File:Carbon Dioxide 400kyr.png, originally made by User: Dragons flight originally made by Dragons flight. The explanation of the figure is also derived from that work. Two new data sets are added: the CO2 measurements from 2004 to 2019 and additional data from Dome C. Some other data sets were omitted for simplicity. The code to produce this figure is freely available on Github: https://github.com/Femkemilene/Global-Warming-Figures. The first few lines of the code make it easy to change the language. |
| Ngày | |
| Nguồn gốc | Tác phẩm được tạo bởi người tải lên |
| Tác giả | Femke Nijsse |
| Phiên bản khác |
File:Carbon Dioxide 800kyr.svg has 4 embedded translations.
|


Data sources
- (light blue) Dome C ice core: Lüthi, D., M. Le Floch, B. Bereiter, T. Blunier, J.-M. Barnola, U. Siegenthaler, D. Raynaud, J. Jouzel, H. Fischer, K. Kawamura, and T.F. Stocker (2008). "High-resolution carbon dioxide concentration record 650,000-800,000 years before present". Nature 453: 379-382. DOI:10.1038/nature06949.
- (dark blue) Vostok ice core: Fischer, H., M. Wahlen, J. Smith, D. Mastroianni, and B. Deck (1999). "Ice core records of Atmospheric CO2 around the last three glacial terminations". Science 283: 1712-1714.
- (navy blue) Taylor Dome ice core: Indermühle, A., E. Monnin, B. Stauffer, T.F. Stocker, M. Wahlen (1999). "Atmospheric CO2 concentration from 60 to 20 kyr BP from the Taylor Dome ice core, Antarctica". Geophysical Research Letters 27: 735-738.
- (green) Law Dome ice core: D.M. Etheridge, L.P. Steele, R.L. Langenfelds, R.J. Francey, J.-M. Barnola and V.I. Morgan (1998) "Historical CO2 records from the Law Dome DE08, DE08-2, and DSS ice cores" in Trends: A Compendium of Data on Global Change. Carbon Dioxide Information Analysis Center, Oak Ridge National Laboratory, U.S. Department of Energy, Oak Ridge, Tenn., U.S.A.
- (black) Mauna Loa Observatory, Hawaii: Keeling, C.D. and T.P. Whorf (2004) "Atmospheric CO2 records from sites in the SIO air sampling network" in Trends: A Compendium of Data on Global Change. Carbon Dioxide Information Analysis Center, Oak Ridge National Laboratory, U.S. Department of Energy, Oak Ridge, Tenn., U.S.A.
Giấy phép
- Bạn được phép:
- chia sẻ – sao chép, phân phối và chuyển giao tác phẩm
- pha trộn – để chuyển thể tác phẩm
- Theo các điều kiện sau:
- ghi công – Bạn phải ghi lại tác giả và nguồn, liên kết đến giấy phép, và các thay đổi đã được thực hiện, nếu có. Bạn có thể làm các điều trên bằng bất kỳ cách hợp lý nào, miễn sao không ám chỉ rằng người cho giấy phép ủng hộ bạn hay việc sử dụng của bạn.
- chia sẻ tương tự – Nếu bạn biến tấu, biến đổi, hoặc làm tác phẩm khác dựa trên tác phẩm này, bạn chỉ được phép phân phối tác phẩm mới theo giấy phép y hệt hoặc tương thích với tác phẩm gốc.
Lịch sử tập tin
Nhấn vào ngày/giờ để xem nội dung tập tin tại thời điểm đó.
| Ngày/giờ | Hình xem trước | Kích cỡ | Thành viên | Miêu tả | |
|---|---|---|---|---|---|
| hiện tại | 11:18, ngày 16 tháng 5 năm 2023 | | 502×339 (52 kB) | Pedalito | File uploaded using svgtranslate tool (https://svgtranslate.toolforge.org/). Added translation for de. |
| 18:05, ngày 19 tháng 4 năm 2022 |  | 502×339 (50 kB) | Jiaminglimjm | File uploaded using svgtranslate tool (https://svgtranslate.toolforge.org/). Added translation for id. | |
| 03:41, ngày 9 tháng 1 năm 2022 |  | 502×339 (48 kB) | TAKAHASHI Shuuji | File uploaded using svgtranslate tool (https://svgtranslate.toolforge.org/). Added translation for ja. | |
| 14:11, ngày 17 tháng 12 năm 2021 |  | 502×339 (46 kB) | Femke | File uploaded using svgtranslate tool (https://svgtranslate.toolforge.org/). Added translation for nl. | |
| 15:44, ngày 11 tháng 9 năm 2020 |  | 502×339 (41 kB) | Femke | Remove the circle for the inset. I changed the axis limits so that the line doesn't cross the year 2000 any more. Made the connecting lines dashed. | |
| 16:28, ngày 29 tháng 3 năm 2020 |  | 502×339 (41 kB) | Femke | Again, spaces seem to be removed when I try to make text editable. | |
| 16:27, ngày 29 tháng 3 năm 2020 |  | 502×339 (41 kB) | Femke | fontsize increase, update to 2019, colour change for one of the lines, fatter arrow. | |
| 13:22, ngày 10 tháng 6 năm 2018 |  | 509×344 (68 kB) | Femke | Changed the background color to a more neutral color. Changed the rectangle to oval to indicate that the inset figure zooms in further than the rectangle showed before. | |
| 11:58, ngày 27 tháng 5 năm 2018 |  | 509×344 (68 kB) | Femke | User created page with UploadWizard |
Trang sử dụng tập tin
Chưa có trang nào ở Wikipedia tiếng Việt liên kết đến tập tin này.
Sử dụng tập tin toàn cục
Những wiki sau đang sử dụng tập tin này:
- Trang sử dụng tại ar.wikipedia.org
- Trang sử dụng tại ar.wikiversity.org
- Trang sử dụng tại arz.wikipedia.org
- Trang sử dụng tại az.wikipedia.org
- Trang sử dụng tại dag.wikipedia.org
- Trang sử dụng tại de.wikipedia.org
- Trang sử dụng tại en.wikipedia.org
- Causes of climate change
- Carbon cycle
- Climate variability and change
- Climate change
- Atmospheric carbon cycle
- Wikipedia:WikiProject Climate change/Figures
- 2022 in science
- Portal:Climate change
- User talk:Femke/Archive 2
- Talk:Climate variability and change/Archive 8
- User talk:InformationToKnowledge/sandbox
- Trang sử dụng tại en.wikibooks.org
- Trang sử dụng tại fi.wikipedia.org
- Trang sử dụng tại ha.wikipedia.org
- Trang sử dụng tại hu.wikipedia.org
- Trang sử dụng tại hy.wikipedia.org
- Trang sử dụng tại id.wikipedia.org
- Trang sử dụng tại ja.wikipedia.org
- Trang sử dụng tại ko.wikipedia.org
- Trang sử dụng tại ku.wikipedia.org
- Trang sử dụng tại kw.wikipedia.org
- Trang sử dụng tại mk.wikipedia.org
- Trang sử dụng tại ru.wikipedia.org
- Trang sử dụng tại ru.wikinews.org
- Trang sử dụng tại rw.wikipedia.org
- Trang sử dụng tại ta.wikipedia.org
- Trang sử dụng tại te.wikipedia.org
- Trang sử dụng tại th.wikipedia.org
- Trang sử dụng tại tr.wikipedia.org
- Trang sử dụng tại www.wikidata.org
- Trang sử dụng tại zh.wikipedia.org