
Tập tin:Mauna Loa Carbon Dioxide-en.svg

Tập tin gốc (tập tin SVG, 850×547 điểm ảnh trên danh nghĩa, kích thước: 16 kB)
Tập tin này từ Wikimedia Commons. Trang miêu tả nó ở đấy được sao chép dưới đây. Commons là kho lưu trữ tập tin phương tiện có giấy phép tự do. Bạn có thể tham gia. |
Miêu tả
| Miêu tả |
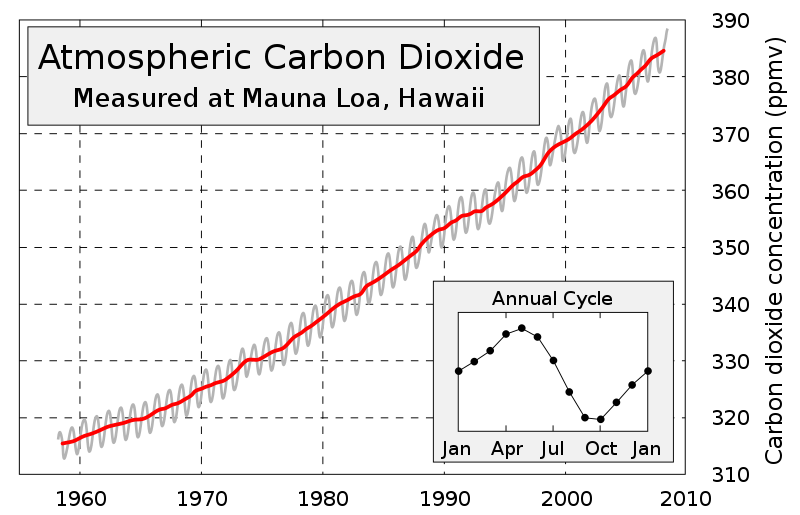
English: This figure shows the history of atmospheric carbon dioxide concentrations as directly measured at Mauna Loa, Hawaii. This curve is known as the Keeling curve, and is an essential piece of evidence of the man-made increases in greenhouse gases that are believed to be the cause of global warming. The longest such record exists at Mauna Loa, but these measurements have been independently confirmed at many other sites around the world [1].
The annual fluctuation in carbon dioxide is caused by seasonal variations in carbon dioxide uptake by land plants. Since many more forests are concentrated in the Northern Hemisphere, more carbon dioxide is removed from the atmosphere during Northern Hemisphere summer than Southern Hemisphere summer. This annual cycle is shown in the inset figure by taking the average concentration for each month across all measured years. The grey curve shows the average monthly concentrations, and red curve is a moving 12 month average.Français : Évolution de la teneur atmosphérique en dioxyde de carbone, mesurée depuis le volcan Mauna Loa, dans l'île de Hawaii. La courbe de cette évolution est connue sous le nom de « courbe de Keeling », et est une preuve évidente de la production humaine de gaz à effet de serre et de son impact sur le réchauffement climatique. C'est sur le Mauna Loa que les taux mesurés sont les plus élevés, mais on retrouve la même évolution sur d'autres sites dans le monde (voir ici).
La fluctuation annuelle de dioxyde de carbone est dûe aux variation saisonnière causées par les plantes. Comme beaucoup de forêts se trouvent dans l'hémisphère nord, il y a plus de rejet de gaz carbonique dans l'atmosphère durant l'été septentrional que pendant l'été austral. Ce cycle annuel est indiqué dans l'encart en bas à droite de l'image, et montre la concentration moyenne de gaz au cours des différents mois. Ce cycle se répète quelle que soit l'année observée. La courbe grise montre la teneur moyenne mensuelle de dioxyde de carbone, et la courbe rouge représente la moyenne annuelle. |
||
| Ngày | |||
| Nguồn gốc | Image:Mauna Loa Carbon Dioxide.png, uploaded in Commons by Nils Simon under licence GFDL & CC-NC-SA ; itself created by Robert A. Rohde from NOAA published data and is incorporated into the Global Warming Art project. | ||
| Tác giả | Sémhur | ||
| Phiên bản khác |
[]
Updated version (2015)
| ||
| Ghi công (required by the license) | © Sémhur / Wikimedia Commons / | ||
| SVG | W3C-validity not checked. This W3C-unspecified vector image was created with Inkscape .
|
||
| Graphic Lab |

| Vị trí máy chụp hình | | Xem hình này và các hình ảnh lân cận trên: OpenStreetMap |
|---|
Giấy phép
| Copyleft: Công trình nghệ thuật này là tác phẩm tự do; bạn được tự do tái phân phối và/hoặc sửa đổi nó dưới những điều kiện của Giấy phép Nghệ thuật Tự do. Có thể đọc nguyên văn giấy phép này tại trang Copyleft Attitude và những trang khác. |
- Bạn được phép:
- chia sẻ – sao chép, phân phối và chuyển giao tác phẩm
- pha trộn – để chuyển thể tác phẩm
- Theo các điều kiện sau:
- ghi công – Bạn phải ghi lại tác giả và nguồn, liên kết đến giấy phép, và các thay đổi đã được thực hiện, nếu có. Bạn có thể làm các điều trên bằng bất kỳ cách hợp lý nào, miễn sao không ám chỉ rằng người cho giấy phép ủng hộ bạn hay việc sử dụng của bạn.
- chia sẻ tương tự – Nếu bạn biến tấu, biến đổi, hoặc làm tác phẩm khác dựa trên tác phẩm này, bạn chỉ được phép phân phối tác phẩm mới theo giấy phép y hệt hoặc tương thích với tác phẩm gốc.
Lịch sử tập tin
Nhấn vào ngày/giờ để xem nội dung tập tin tại thời điểm đó.
| Ngày/giờ | Hình xem trước | Kích cỡ | Thành viên | Miêu tả | |
|---|---|---|---|---|---|
| hiện tại | 10:19, ngày 29 tháng 6 năm 2008 | | 850×547 (16 kB) | Sémhur | clean-up |
| 09:30, ngày 27 tháng 6 năm 2008 |  | 850×547 (31 kB) | Sémhur | Data updated (now, from 1958 to june 2008) | |
| 13:51, ngày 23 tháng 4 năm 2008 |  | 800×547 (33 kB) | Sémhur | Without the bitmap, it's better | |
| 13:48, ngày 23 tháng 4 năm 2008 |  | 800×547 (33 kB) | Sémhur | {{Information |Description= {{en|This figure shows the history of atmospheric carbon dioxide concentrations as directly measured at Mauna Loa, Hawaii. This curve is known as the [ |
Trang sử dụng tập tin
Chưa có trang nào ở Wikipedia tiếng Việt liên kết đến tập tin này.
Sử dụng tập tin toàn cục
Những wiki sau đang sử dụng tập tin này:
- Trang sử dụng tại af.wikipedia.org
- Trang sử dụng tại ar.wikipedia.org
- Trang sử dụng tại en.wikipedia.org
- Trang sử dụng tại fr.wikipedia.org
- Trang sử dụng tại ko.wikipedia.org
- Trang sử dụng tại zh.wikipedia.org