
Tập tin:Annual real food price indices.svg

Tập tin gốc (tập tin SVG, 760×370 điểm ảnh trên danh nghĩa, kích thước: 11 kB)
Tập tin này từ Wikimedia Commons. Trang miêu tả nó ở đấy được sao chép dưới đây. Commons là kho lưu trữ tập tin phương tiện có giấy phép tự do. Bạn có thể tham gia. |
Miêu tả
| Miêu tả |
English: Source of data: http://www.fao.org/fileadmin/templates/worldfood/Reports_and_docs/Food_price_indices_data.xls
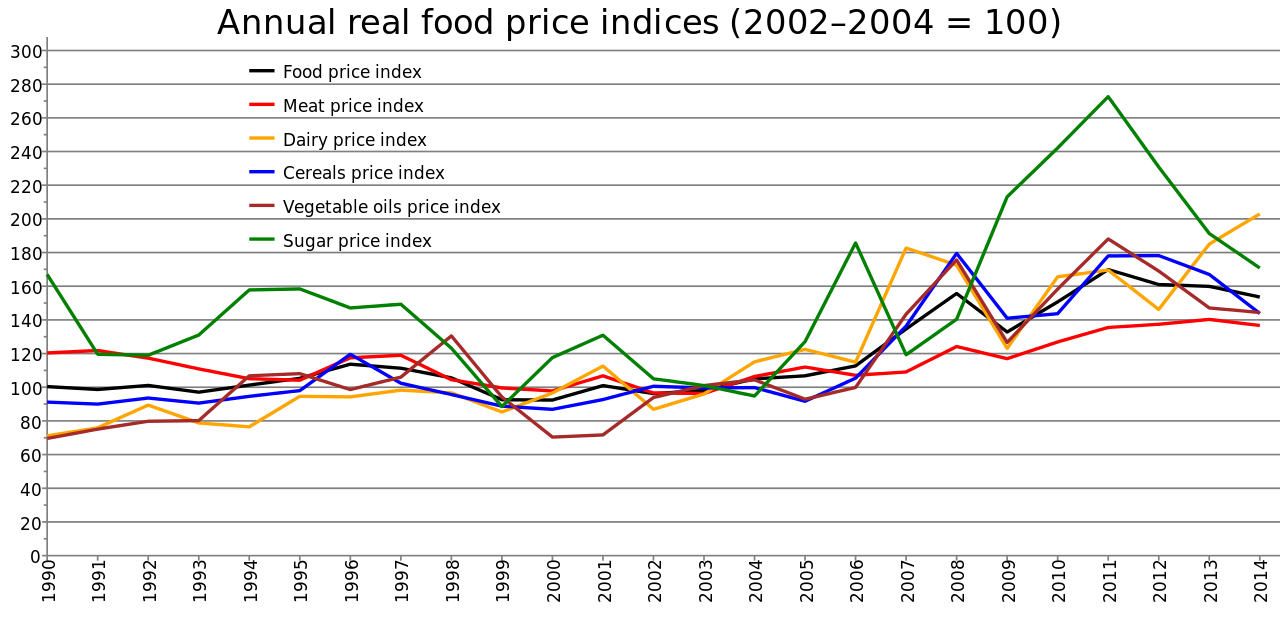
Food Price Index: Consists of the average of 5 commodity group price indices mentioned above, weighted with the average export shares of each of the groups for 2002-2004: in total 73 price quotations considered by FAO commodity specialists as representing the international prices of the food commodities noted are included in the overall index. Each sub-index is a weighted average of the price relatives of the commodities included in the group, with the base period price consisting of the averages for the years 2002-2004. Meat Price Index: Computed from average prices of four types of meat, weighted by world average export trade shares for 2002-2004. Commodities include two poultry products, three bovine meat products, three pig meat products, and one ovine meat product. There are 27 price quotations in total used in the calculation of the index. Where more than one quotation exists for a given meat type, a simple average is used. Prices for the two most recent months may be estimates and subject to revision. Dairy Price Index: Consists of butter, SMP, WMP, and cheese price quotations; the average is weighted by world average export trade shares for 2002-2004. Cereals Price Index: This index is compiled using the International Grains Council (IGC) wheat price index, itself an average of 10 different wheat price quotations, 1 maize export quotation and 16 rice quotations. The rice quotations are combined into three groups consisting of Indica, Japonica and Aromatic rice varieties. Within each variety, a simple average of the relative prices of appropriate quotations is calculated; then the average relative prices of each of the three varieties are combined by weighting them with their assumed (fixed) trade shares. Subsequently, the IGC wheat price index, after converting it to base 2002-2004, the relative prices of maize and the average relative prices calculated for the rice group as a whole are combined by weighting each commodity with its average export trade share for 2002-2004. Vegetable Oil Price Index: Consists of an average of 10 different oils weighted with average export trade shares of each oil product for 2002-2004. Sugar Price Index: Index form of the International Sugar Agreement prices with 2002-2004 as base. All indices have been deflated using the World Bank Manufactures Unit Value Index (MUV) rebased from 2005=100 to 2002-2004=100. |
| Ngày | |
| Nguồn gốc | Tác phẩm được tạo bởi người tải lên |
| Tác giả | Nigelj |
Giấy phép
- Bạn được phép:
- chia sẻ – sao chép, phân phối và chuyển giao tác phẩm
- pha trộn – để chuyển thể tác phẩm
- Theo các điều kiện sau:
- ghi công – Bạn phải ghi lại tác giả và nguồn, liên kết đến giấy phép, và các thay đổi đã được thực hiện, nếu có. Bạn có thể làm các điều trên bằng bất kỳ cách hợp lý nào, miễn sao không ám chỉ rằng người cho giấy phép ủng hộ bạn hay việc sử dụng của bạn.
- chia sẻ tương tự – Nếu bạn biến tấu, biến đổi, hoặc làm tác phẩm khác dựa trên tác phẩm này, bạn chỉ được phép phân phối tác phẩm mới theo giấy phép y hệt hoặc tương thích với tác phẩm gốc.
Lịch sử tập tin
Nhấn vào ngày/giờ để xem nội dung tập tin tại thời điểm đó.
| Ngày/giờ | Hình xem trước | Kích cỡ | Thành viên | Miêu tả | |
|---|---|---|---|---|---|
| hiện tại | 22:34, ngày 19 tháng 3 năm 2014 | | 760×370 (11 kB) | Nigelj | Tweak legend and description |
| 22:22, ngày 19 tháng 3 năm 2014 |  | 760×370 (11 kB) | Nigelj | Simplify CSS hoping that the Commons renderer can cope this time | |
| 22:05, ngày 19 tháng 3 năm 2014 |  | 760×370 (11 kB) | Nigelj | User created page with UploadWizard |
Trang sử dụng tập tin
Sử dụng tập tin toàn cục
Những wiki sau đang sử dụng tập tin này:
- Trang sử dụng tại ar.wikipedia.org
- Trang sử dụng tại en.wikipedia.org
- Trang sử dụng tại hy.wikipedia.org
- Trang sử dụng tại nl.wikipedia.org