
Tập tin:Health Insurance Coverage in the U.S. 2016 - v1.png
Kích thước hình xem trước: 800×453 điểm ảnh. Độ phân giải khác: 320×181 điểm ảnh | 640×362 điểm ảnh | 1.024×580 điểm ảnh | 1.392×788 điểm ảnh.
Tập tin gốc (1.392×788 điểm ảnh, kích thước tập tin: 78 kB, kiểu MIME: image/png)
Tập tin này từ Wikimedia Commons. Trang miêu tả nó ở đấy được sao chép dưới đây. Commons là kho lưu trữ tập tin phương tiện có giấy phép tự do. Bạn có thể tham gia. |
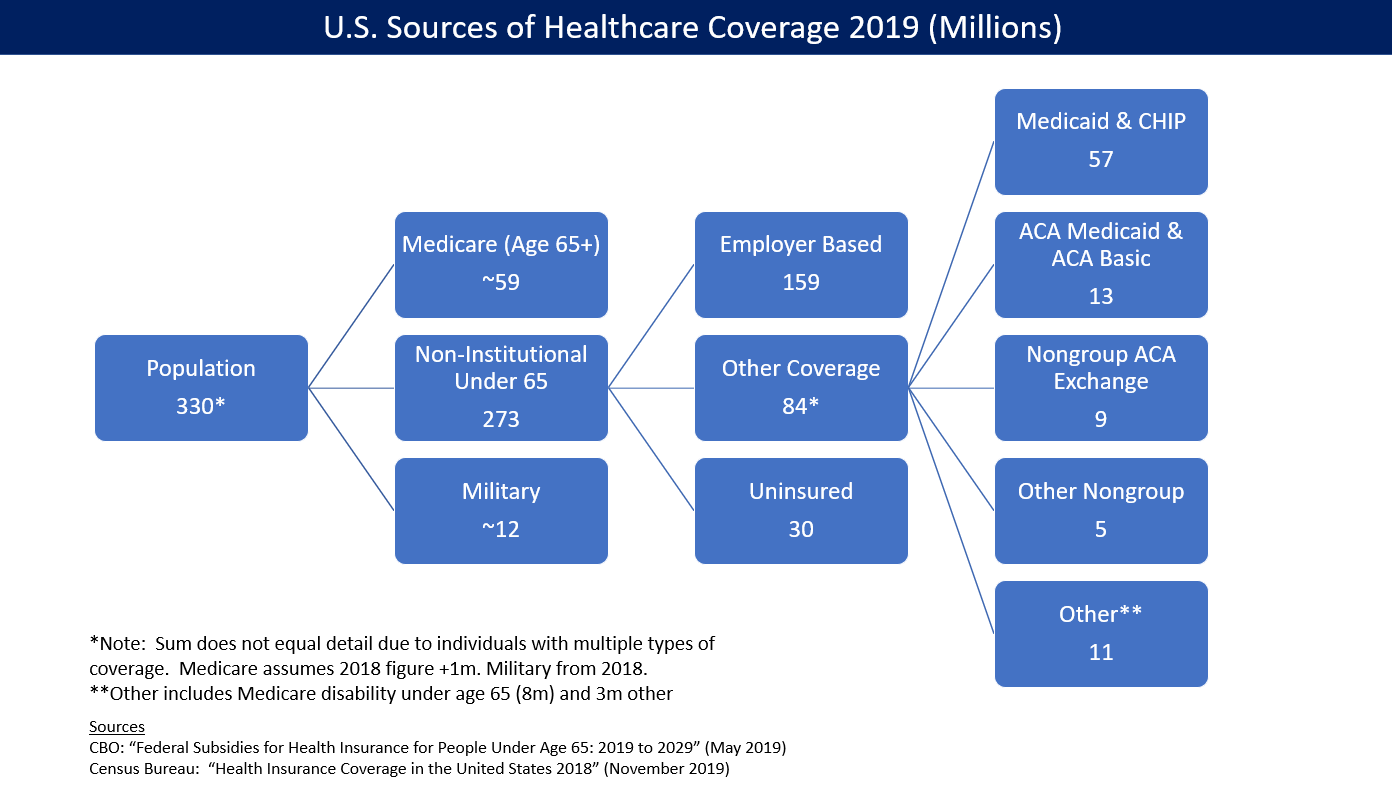
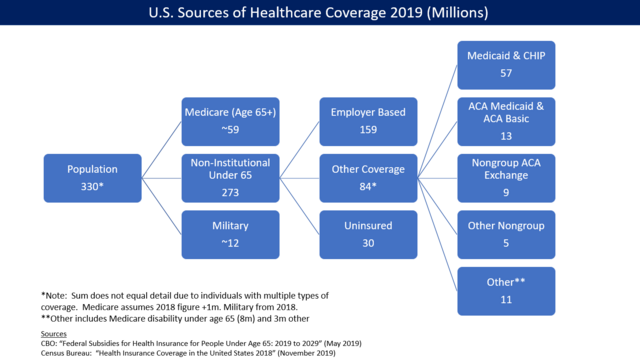
Understanding the chart
The health insurance coverage statistics are made more complex because of persons with multiple forms of coverage (e.g., both employer-provided insurance and Medicaid).
- A primary source for the graphic is from the CBO, which estimated the 2016 amounts for the under 65 group in March 2016.[1]
- The total U.S. population in 2016 was about 324m according to FRED.[2] However, due to the problem with multiple forms of coverage, components in the second layer add up to 340.
- Another source for the Medicare and Military figures is from the Census Bureau.[3]
Neither source presents the complete picture and they are for different time periods, so the diagram should be used as approximations rather than exact portrayal of the figures as of the end of 2016.
Miêu tả
| Miêu tả |
English: U.S. health insurance coverage by source in 2016. CBO estimated ACA/Obamacare was responsible for 23 million persons covered via exchanges and Medicaid expansion. |
| Ngày | |
| Nguồn gốc | Tác phẩm được tạo bởi người tải lên |
| Tác giả | Farcaster |
Giấy phép
Tôi, người giữ bản quyền tác phẩm này, từ đây phát hành nó theo giấy phép sau:
Tập tin này được phát hành theo Giấy phép Creative Commons Ghi công–Chia sẻ tương tự 4.0 Quốc tế.
- Bạn được phép:
- chia sẻ – sao chép, phân phối và chuyển giao tác phẩm
- pha trộn – để chuyển thể tác phẩm
- Theo các điều kiện sau:
- ghi công – Bạn phải ghi lại tác giả và nguồn, liên kết đến giấy phép, và các thay đổi đã được thực hiện, nếu có. Bạn có thể làm các điều trên bằng bất kỳ cách hợp lý nào, miễn sao không ám chỉ rằng người cho giấy phép ủng hộ bạn hay việc sử dụng của bạn.
- chia sẻ tương tự – Nếu bạn biến tấu, biến đổi, hoặc làm tác phẩm khác dựa trên tác phẩm này, bạn chỉ được phép phân phối tác phẩm mới theo giấy phép y hệt hoặc tương thích với tác phẩm gốc.
- ↑ CBO-Federal Subsidies for Health Insurance Coverage for People Under Age 65: 2016 to 2026-March 2016
- ↑ FRED-Total Population
- ↑ Health Insurance Coverage in the United States:2015-Issued September 2016
Lịch sử tập tin
Nhấn vào ngày/giờ để xem nội dung tập tin tại thời điểm đó.
| Ngày/giờ | Hình xem trước | Kích cỡ | Thành viên | Miêu tả | |
|---|---|---|---|---|---|
| hiện tại | 19:42, ngày 10 tháng 1 năm 2020 | | 1.392×788 (78 kB) | Farcaster | Updated for 2019 |
| 17:21, ngày 25 tháng 8 năm 2017 |  | 1.247×704 (119 kB) | Farcaster | Updated information | |
| 15:22, ngày 30 tháng 7 năm 2017 |  | 1.238×693 (172 kB) | Farcaster | User created page with UploadWizard |
Trang sử dụng tập tin
Có 2 trang tại Wikipedia tiếng Việt có liên kết đến tập tin (không hiển thị trang ở các dự án khác):
Sử dụng tập tin toàn cục
Những wiki sau đang sử dụng tập tin này:
- Trang sử dụng tại en.wikipedia.org
- Trang sử dụng tại tr.wikipedia.org
- Trang sử dụng tại uz.wikipedia.org
- Trang sử dụng tại zh.wikipedia.org